Monday, June 30, 2025

Authorities Expecting The Sixth Seal? (Revelation 6:12)


New York Times
By SAM ROBERTS
JULY 17, 2014
Here is another reason to buy a megAuthorities Expecting The Sixth Seal? (Revelation 6:12)a-million-dollar apartment in a Manhattan high-rise: Earthquake forecast maps for New York City that a federal agency issued on Thursday indicate “a slightly lower hazard for tall buildings than previously thought.”
The agency, the United States Geodetic Survey, tempered its latest quake prediction with a big caveat.
Federal seismologists based their projections of a lower hazard for tall buildings — “but still a hazard nonetheless,” they cautioned — on a lower likelihood of slow shaking from an earthquake occurring near the city, the type of shaking that typically causes more damage to taller structures.
“The tall buildings in Manhattan are not where you should be focusing,” said John Armbruster, a seismologist with the Lamont-Doherty Earth Observatory of Columbia University. “They resonate with long period waves. They are designed and engineered to ride out an earthquake. Where you should really be worried in New York City is the common brownstone and apartment building and buildings that are poorly maintained.”
Mr. Armbruster was not involved in the federal forecast, but was an author of an earlier study that suggested that “a pattern of subtle but active faults makes the risk of earthquakes to the New York City area substantially greater than formerly believed.”
He noted that barely a day goes by without a New York City building’s being declared unsafe, without an earthquake. “If you had 30, 40, 50 at one time, responders would be overloaded,” he said.
The city does have an earthquake building code that went into effect in 1996, and that applies primarily to new construction.
A well-maintained building would probably survive a magnitude 5 earthquake fairly well, he said. The last magnitude 5 earthquake in the city struck in 1884. Another is not necessarily inevitable; faults are more random and move more slowly than they do in, say, California. But he said the latest federal estimate was probably raised because of the magnitude of the Virginia quake.

Mr. Armbruster said the Geodetic Survey forecast would not affect his daily lifestyle. “I live in a wood-frame building with a brick chimney and I’m not alarmed sitting up at night worried about it,” he said. “But society’s leaders need to take some responsibility.” 

Tuesday, June 24, 2025

Two Centuries Before The Sixth Seal (Revelation 6:12)


The worst earthquake in Massachusetts history 260 years ago
It happened before, and it could happen again.
By Hilary Sargent @lilsarg
Boston.com Staff | 11.19.15 | 5:53 AM
On November 18, 1755, Massachusetts experienced its largest recorded earthquake.
The earthquake occurred in the waters off Cape Ann, and was felt within seconds in Boston, and as far away as Nova Scotia, the Chesapeake Bay, and upstate New York, according to the U.S. Geological Survey.
Seismologists have since estimated the quake to have been between 6.0 and 6.3 on the Richter scale, according to the Massachusetts Historical Society.
While there were no fatalities, the damage was extensive.
According to the USGS, approximately 100 chimneys and roofs collapsed, and over a thousand were damaged.
The worst damage occurred north of Boston, but the city was not unscathed.
A 1755 report in The Philadelphia Gazette described the quake’s impact on Boston:
“There was at first a rumbling noise like low thunder, which was immediately followed with such a violent shaking of the earth and buildings, as threw every into the greatest amazement, expecting every moment to be buried in the ruins of their houses. In a word, the instances of damage done to our houses and chimnies are so many, that it would be endless to recount them.”
The quake sent the grasshopper weathervane atop Faneuil Hall tumbling to the ground, according to the Massachusetts Historical Society.
An account of the earthquake, published in The Pennsylvania Gazette on December 4, 1755.
The earthquake struck at 4:30 in the morning, and the shaking lasted “near four minutes,” according to an entry John Adams, then 20, wrote in his diary that day.
The brief diary entry described the damage he witnessed.
“I was then at my Fathers in Braintree, and awoke out of my sleep in the midst of it,” he wrote. “The house seemed to rock and reel and crack as if it would fall in ruins about us. 7 Chimnies were shatter’d by it within one mile of my Fathers house.”
The shaking was so intense that the crew of one ship off the Boston coast became convinced the vessel had run aground, and did not learn about the earthquake until they reached land, according to the Massachusetts Historical Society.
In 1832, a writer for the Hampshire (Northampton) Gazette wrote about one woman’s memories from the quake upon her death.
“It was between 4 and 5 in the morning, and the moon shone brightly. She and the rest of the family were suddenly awaked from sleep by a noise like that of the trampling of many horses; the house trembled and the pewter rattled on the shelves. They all sprang out of bed, and the affrightted children clung to their parents. “I cannot help you dear children,” said the good mother, “we must look to God for help.”
The Cape Ann earthquake came just 17 days after an earthquake estimated to have been 8.5-9.0 on the Richter scale struck in Lisbon, Portugal, killing at least 60,000 and causing untold damage.
There was no shortage of people sure they knew the impretus for the Cape Ann earthquake.
According to many ministers in and around Boston, “God’s wrath had brought this earthquake upon Boston,” according to the Massachusetts Historical Society.
In “Verses Occasioned by the Earthquakes in the Month of November, 1755,” Jeremiah Newland, a Taunton resident who was active in religious activities in the Colony, wrote that the earthquake was a reminder of the importance of obedience to God.
“It is becaufe we broke thy Laws,
that thou didst shake the Earth.

O what a Day the Scriptures say,
the EARTHQUAKE doth foretell;
O turn to God; lest by his Rod,
he cast thee down to Hell.”
Boston Pastor Jonathan Mayhew warned in a sermon that the 1755 earthquakes in Massachusetts and Portugal were “judgments of heaven, at least as intimations of God’s righteous displeasure, and warnings from him.”
There were some, though, who attempted to put forth a scientific explanation for the earthquake.
Well, sort of.
In a lecture delivered just a week after the earthquake, Harvard mathematics professor John Winthrop said the quake was the result of a reaction between “vapors” and “the heat within the bowels of the earth.” But even Winthrop made sure to state that his scientific theory “does not in the least detract from the majesty … of God.”
It has been 260 years since the Cape Ann earthquake. Some experts, including Boston College seismologist John Ebel, think New England could be due for another significant quake.
In a recent Boston Globe report, Ebel said the New England region “can expect a 4 to 5 magnitude quake every decade, a 5 to 6 every century, and a magnitude 6 or above every thousand years.”
If the Cape Ann earthquake occurred today, “the City of Boston could sustain billions of dollars of earthquake damage, with many thousands injured or killed,” according to a 1997 study by the US Army Corps of Engineers.

Saturday, June 21, 2025

The Quakes Preceding the Sixth Seal: Revelation 6:12


East Coast Quakes: What to Know About the Tremors Below

By Meteorologist Dominic Ramunni Nationwide PUBLISHED 7:13 PM ET Aug. 11, 2020 PUBLISHED 7:13 PM EDT Aug. 11, 2020

People across the Carolinas and Mid-Atlantic were shaken, literally, on a Sunday morning as a magnitude 5.1 earthquake struck in North Carolina on August 9, 2020.

Centered in Sparta, NC, the tremor knocked groceries off shelves and left many wondering just when the next big one could strike.

Items lie on the floor of a grocery store after an earthquake on Sunday, August 9, 2020 in North Carolina.

Fault Lines

Compared to the West Coast, there are far fewer fault lines in the East. This is why earthquakes in the East are relatively uncommon and weaker in magnitude.

That said, earthquakes still occur in the East.

According to Spectrum News Meteorologist Matthew East, “Earthquakes have occurred in every eastern U.S. state, and a majority of states have recorded damaging earthquakes. However, they are pretty rare. For instance, the Sparta earthquake Sunday was the strongest in North Carolina in over 100 years.”

While nowhere near to the extent of the West Coast, damaging earthquakes can and do affect much of the eastern half of the country.

For example, across the Tennesse River Valley lies the New Madrid Fault Line. While much smaller in size than those found farther west, the fault has managed to produce several earthquakes over magnitude 7.0 in the last couple hundred years.

In 1886, an estimated magnitude 7.0 struck Charleston, South Carolina along a previously unknown seismic zone. Nearly the entire town had to be rebuilt.

Vulnerabilities

The eastern half of the U.S. has its own set of vulnerabilities from earthquakes.

Seismic waves actually travel farther in the East as opposed to the West Coast. This is because the rocks that make up the East are tens, if not hundreds, of millions of years older than in the West.

These older rocks have had much more time to bond together with other rocks under the tremendous pressure of Earth’s crust. This allows seismic energy to transfer between rocks more efficiently during an earthquake, causing the shaking to be felt much further.

This is why, during the latest quake in North Carolina, impacts were felt not just across the state, but reports of shaking came as far as Atlanta, Georgia, nearly 300 miles away.

Reports of shaking from different earthquakes of similar magnitude.

Quakes in the East can also be more damaging to infrastructure than in the West. This is generally due to the older buildings found east. Architects in the early-to-mid 1900s simply were not accounting for earthquakes in their designs for cities along the East Coast.

When a magnitude 5.8 earthquake struck Virginia in 2011, not only were numerous historical monuments in Washington, D.C. damaged, shaking was reported up and down the East Coast with tremors even reported in Canada.

Unpredictable

There is no way to accurately predict when or where an earthquake may strike.

Some quakes will have a smaller earthquake precede the primary one. This is called a foreshock.

The problem is though, it’s difficult to say whether the foreshock is in fact a foreshock and not the primary earthquake. Only time will tell the difference.

The United State Geological Survey (USGS) is experimenting with early warning detection systems in the West Coast.

While this system cannot predict earthquakes before they occur, they can provide warning up to tens of seconds in advance that shaking is imminent. This could provide just enough time to find a secure location before the tremors begin.

Much like hurricanes, tornadoes, or snowstorms, earthquakes are a natural occuring phenomenon that we can prepare for.

The USGS provides an abundance of resources on how to best stay safe when the earth starts to quake.

Wednesday, June 18, 2025

The History Of New York Earthquakes: Before The Sixth Seal (Revelation 6:12)


Historic Earthquakes
Near New York City, New York
1884 08 10 19:07 UTC
Magnitude 5.5The History Of New York Earthquakes: Before The Sixth Seal (Rev 6:12)
Intensity VII
USGS.gov
This severe earthquake affected an area roughly extending along the Atlantic Coast from southern Maine to central Virginia and westward to Cleveland, Ohio. Chimneys were knocked down and walls were cracked in several States, including Connecticut, New Jersey, New York, and Pennsylvania. Many towns from Hartford, Connecticut, to West Chester,Pennsylvania.
Property damage was severe at Amityville and Jamaica, New York, where several chimneys were “overturned” and large cracks formed in walls. Two chimneys were thrown down and bricks were shaken from other chimneys at Stratford (Fairfield County), Conn.; water in the Housatonic River was agitated violently. At Bloomfield, N.J., and Chester, Pa., several chimneys were downed and crockery was broken. Chimneys also were damaged at Mount Vernon, N.Y., and Allentown, Easton, and Philadelphia, Pa. Three shocks occurred, the second of which was most violent. This earthquake also was reported felt in Vermont, Virginia, and Washington, D.C. Several slight aftershocks were reported on August 11.
Teilen mit:
TwitterFacebook

Monday, June 16, 2025

1884 A Forewarning Of The Sixth Seal (Revelation 6:12)


The Coney Island earthquake of 1884

New York City isn’t immune to earthquakes; a couple of small tremors measuring about 2.5 on the Richter scale even struck back in 2001 and 2002.
The quake was subsequently thought to have been centered off Far Rockaway or Coney Island.
Translation: We’re about 30 years overdue. Lucky for us the city adopted earthquake-resistant building codes in 1995.

Columbia University Warns Of Sixth Seal (Revelation 6:12)


Earthquakes May Endanger New York More Than Thought, Says Study
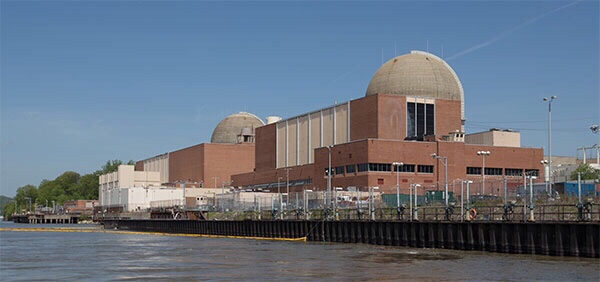
A study by a group of prominent seismologists suggests that a pattern of subtle but active faults makes the risk of earthquakes to the New York City area substantially greater than formerly believed. Among other things, they say that the controversial Indian Point nuclear power plants, 24 miles north of the city, sit astride the previously unidentified intersection of two active seismic zones. The paper appears in the current issue of the Bulletin of the Seismological Society of America.
Many faults and a few mostly modest quakes have long been known around New York City, but the research casts them in a new light. The scientists say the insight comes from sophisticated analysis of past quakes, plus 34 years of new data on tremors, most of them perceptible only by modern seismic instruments. The evidence charts unseen but potentially powerful structures whose layout and dynamics are only now coming clearer, say the scientists. All are based at Columbia University’s Lamont-Doherty Earth Observatory, which runs the network of seismometers that monitors most of the northeastern United States.
Lead author Lynn R. Sykes said the data show that large quakes are infrequent around New Yorkcompared to more active areas like California and Japan, but that the risk is high, because of the overwhelming concentration of people and infrastructure. “The research raises the perception both of how common these events are, and, specifically, where they may occur,” he said. “It’s an extremely populated area with very large assets.” Sykes, who has studied the region for four decades, is known for his early role in establishing the global theory of plate tectonics.
The authors compiled a catalog of all 383 known earthquakes from 1677 to 2007 in a 15,000-square-mile area around New York City. Coauthor John Armbruster estimated sizes and locations of dozens of events before 1930 by combing newspaper accounts and other records. The researchers say magnitude 5 quakes—strong enough to cause damage–occurred in 1737, 1783 and 1884. There was little settlement around to be hurt by the first two quakes, whose locations are vague due to a lack of good accounts; but the last, thought to be centered under the seabed somewhere between Brooklyn and Sandy Hook, toppled chimneys across the city and New Jersey, and panicked bathers at Coney Island. Based on this, the researchers say such quakes should be routinely expected, on average, about every 100 years. “Today, with so many more buildings and people, a magnitude 5 centered below the city would be extremely attention-getting,” said Armbruster. “We’d see billions in damage, with some brick buildings falling. People would probably be killed.”
Starting in the early 1970s Lamont began collecting data on quakes from dozens of newly deployed seismometers; these have revealed further potential, including distinct zones where earthquakes concentrate, and where larger ones could come. The Lamont network, now led by coauthor Won-Young Kim, has located hundreds of small events, including a magnitude 3 every few years, which can be felt by people at the surface, but is unlikely to cause damage. These small quakes tend to cluster along a series of small, old faults in harder rocks across the region. Many of the faults were discovered decades ago when subways, water tunnels and other excavations intersected them, but conventional wisdom said they were inactive remnants of continental collisions and rifting hundreds of millions of years ago. The results clearly show that they are active, and quite capable of generating damaging quakes, said Sykes.
One major previously known feature, the Ramapo Seismic Zone, runs from eastern Pennsylvania to the mid-Hudson Valley, passing within a mile or two northwest of Indian Point. The researchers found that this system is not so much a single fracture as a braid of smaller ones, where quakes emanate from a set of still ill-defined faults. East and south of the Ramapo zone—and possibly more significant in terms of hazard–is a set of nearly parallel northwest-southeast faults. These include Manhattan’s 125th Street fault, which seems to have generated two small 1981 quakes, and could have been the source of the big 1737 quake; the Dyckman Street fault, which carried a magnitude 2 in 1989; the Mosholu Parkway fault; and the Dobbs Ferry fault in suburban Westchester, which generated the largest recent shock, a surprising magnitude 4.1, in 1985. Fortunately, it did no damage. Given the pattern, Sykes says the big 1884 quake may have hit on a yet-undetected member of this parallel family further south.
The researchers say that frequent small quakes occur in predictable ratios to larger ones, and so can be used to project a rough time scale for damaging events. Based on the lengths of the faults, the detected tremors, and calculations of how stresses build in the crust, the researchers say that magnitude 6 quakes, or even 7—respectively 10 and 100 times bigger than magnitude 5–are quite possible on the active faults they describe. They calculate that magnitude 6 quakes take place in the area about every 670 years, and sevens, every 3,400 years. The corresponding probabilities of occurrence in any 50-year period would be 7% and 1.5%. After less specific hints of these possibilities appeared in previous research, a 2003 analysis by The New York City Area Consortium for Earthquake Loss Mitigation put the cost of quakes this size in the metro New York area at $39 billion to $197 billion. A separate 2001 analysis for northern New Jersey’s Bergen County estimates that a magnitude 7 would destroy 14,000 buildings and damage 180,000 in that area alone. The researchers point out that no one knows when the last such events occurred, and say no one can predict when they next might come.
“We need to step backward from the simple old model, where you worry about one large, obvious fault, like they do in California,” said coauthor Leonardo Seeber. “The problem here comes from many subtle faults. We now see there is earthquake activity on them. Each one is small, but when you add them up, they are probably more dangerous than we thought. We need to take a very close look.” Seeber says that because the faults are mostly invisible at the surface and move infrequently, a big quake could easily hit one not yet identified. “The probability is not zero, and the damage could be great,” he said. “It could be like something out of a Greek myth.”
The researchers found concrete evidence for one significant previously unknown structure: an active seismic zone running at least 25 miles from Stamford, Conn., to the Hudson Valley town of Peekskill, N.Y., where it passes less than a mile north of the Indian Point nuclear power plant. The Stamford-Peekskill line stands out sharply on the researchers’ earthquake map, with small events clustered along its length, and to its immediate southwest. Just to the north, there are no quakes, indicating that it represents some kind of underground boundary. It is parallel to the other faults beginning at 125th Street, so the researchers believe it is a fault in the same family. Like the others, they say it is probably capable of producing at least a magnitude 6 quake. Furthermore, a mile or so on, it intersects the Ramapo seismic zone.
Sykes said the existence of the Stamford-Peekskill line had been suggested before, because the Hudson takes a sudden unexplained bend just ot the north of Indian Point, and definite traces of an old fault can be along the north side of the bend. The seismic evidence confirms it, he said. “Indian Point is situated at the intersection of the two most striking linear features marking the seismicity and also in the midst of a large population that is at risk in case of an accident,” says the paper. “This is clearly one of the least favorable sites in our study area from an earthquake hazard and risk perspective.”
The findings comes at a time when Entergy, the owner of Indian Point, is trying to relicense the two operating plants for an additional 20 years—a move being fought by surrounding communities and the New York State Attorney General. Last fall the attorney general, alerted to the then-unpublished Lamont data, told a Nuclear Regulatory Commission panel in a filing: “New data developed in the last 20 years disclose a substantially higher likelihood of significant earthquake activity in the vicinity of [Indian Point] that could exceed the earthquake design for the facility.” The state alleges that Entergy has not presented new data on earthquakes past 1979. However, in a little-noticed decision this July 31, the panel rejected the argument on procedural grounds. A source at the attorney general’s office said the state is considering its options.
The characteristics of New York’s geology and human footprint may increase the problem. Unlike in California, many New York quakes occur near the surface—in the upper mile or so—and they occur not in the broken-up, more malleable formations common where quakes are frequent, but rather in the extremely hard, rigid rocks underlying Manhattan and much of the lower Hudson Valley. Such rocks can build large stresses, then suddenly and efficiently transmit energy over long distances. “It’s like putting a hard rock in a vise,” said Seeber. “Nothing happens for a while. Then it goes with a bang.” Earthquake-resistant building codes were not introduced to New York City until 1995, and are not in effect at all in many other communities. Sinuous skyscrapers and bridges might get by with minimal damage, said Sykes, but many older, unreinforced three- to six-story brick buildings could crumble.
Art Lerner-Lam, associate director of Lamont for seismology, geology and tectonophysics, pointed out that the region’s major highways including the New York State Thruway, commuter and long-distance rail lines, and the main gas, oil and power transmission lines all cross the parallel active faults, making them particularly vulnerable to being cut. Lerner-Lam, who was not involved in the research, said that the identification of the seismic line near Indian Point “is a major substantiation of a feature that bears on the long-term earthquake risk of the northeastern United States.” He called for policymakers to develop more information on the region’s vulnerability, to take a closer look at land use and development, and to make investments to strengthen critical infrastructure.
“This is a landmark study in many ways,” said Lerner-Lam. “It gives us the best possible evidence that we have an earthquake hazard here that should be a factor in any planning decision. It crystallizes the argument that this hazard is not random. There is a structure to the location and timing of the earthquakes. This enables us to contemplate risk in an entirely different way. And since we are able to do that, we should be required to do that.”
New York Earthquake Briefs and Quotes:
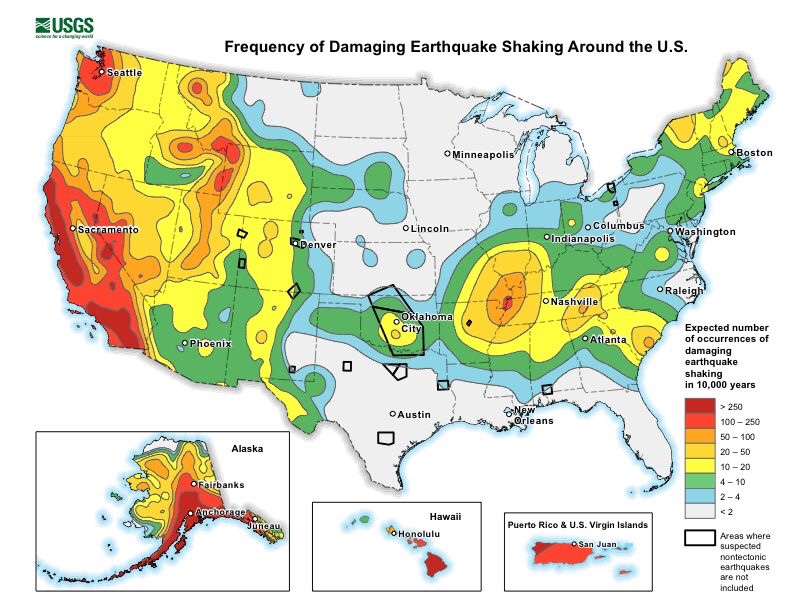
Existing U.S. Geological Survey seismic hazard maps show New York City as facing more hazard than many other eastern U.S. areas. Three areas are somewhat more active—northernmost New York State, New Hampshire and South Carolina—but they have much lower populations and fewer structures. The wider forces at work include pressure exerted from continuing expansion of the mid-Atlantic Ridge thousands of miles to the east; slow westward migration of the North American continent; and the area’s intricate labyrinth of old faults, sutures and zones of weakness caused by past collisions and rifting.
Due to New York’s past history, population density and fragile, interdependent infrastructure, a 2001 analysis by the Federal Emergency Management Agency ranks it the 11th most at-risk U.S. city for earthquake damage. Among those ahead: Los Angeles, San Francisco, Seattle and Portland. Behind: Salt Lake City, Sacramento, Anchorage.
New York’s first seismic station was set up at Fordham University in the 1920s. Lamont-Doherty Earth Observatory, in Palisades, N.Y., has operated stations since 1949, and now coordinates a network of about 40.
Dozens of small quakes have been felt in the New York area. A Jan. 17, 2001 magnitude 2.4, centered  in the Upper East Side—the first ever detected in Manhattan itself–may have originated on the 125th Street fault. Some people thought it was an explosion, but no one was harmed.
The most recent felt quake, a magnitude 2.1 on July 28, 2008, was centered near Milford, N.J. Houses shook and a woman at St. Edward’s Church said she felt the building rise up under her feet—but no damage was done.
Questions about the seismic safety of the Indian Point nuclear power plant, which lies amid a metropolitan area of more than 20 million people, were raised in previous scientific papers in 1978 and 1985.
Because the hard rocks under much of New York can build up a lot strain before breaking, researchers believe that modest faults as short as 1 to 10 kilometers can cause magnitude 5 or 6 quakes.
In general, magnitude 3 quakes occur about 10 times more often than magnitude fours; 100 times more than magnitude fives; and so on. This principle is called the Gutenberg-Richter relationship.

Thursday, June 12, 2025

Economic Consequences of the Sixth Seal (Revelation 6:12)


Scenario Earthquakes for Urban Areas Along the Atlantic Seaboard of the United States

NYCEM.org

If today a magnitude 6 earthquake were to occur centered on New York City, what would its effects be? Will the loss be 10 or 100 billion dollars? Will there be 10 or 10,000 fatalities? Will there be 1,000 or 100,000 homeless needing shelter? Can government function, provide assistance, and maintain order?
At this time, no satisfactory answers to these questions are available. A few years ago, rudimentary scenario studies were made for Boston and New York with limited scope and uncertain results. For most eastern cities, including Washington D.C., we know even less about the economic, societal and political impacts from significant earthquakes, whatever their rate of occurrence.
Why do we know so little about such vital public issues? Because the public has been lulled into believing that seriously damaging quakes are so unlikely in the east that in essence we do not need to consider them. We shall examine the validity of this widely held opinion.
Is the public’s earthquake awareness (or lack thereof) controlled by perceived low Seismicity, Seismic Hazard, or Seismic Risk? How do these three seismic features differ from, and relate to each other? In many portions of California, earthquake awareness is refreshed in a major way about once every decade (and in some places even more often) by virtually every person experiencing a damaging event. The occurrence of earthquakes of given magnitudes in time and space, not withstanding their effects, are the manifestations of seismicity. Ground shaking, faulting, landslides or soil liquefaction are the manifestations of seismic hazard. Damage to structures, and loss of life, limb, material assets, business and services are the manifestations of seismic risk. By sheer experience, California’s public understands fairly well these three interconnected manifestations of the earthquake phenomenon. This awareness is reflected in public policy, enforcement of seismic regulations, and preparedness in both the public and private sector. In the eastern U.S., the public and its decision makers generally do not understand them because of inexperience. Judging seismic risk by rates of seismicity alone (which are low in the east but high in the west) has undoubtedly contributed to the public’s tendency to belittle the seismic loss potential for eastern urban regions.
Let us compare two hypothetical locations, one in California and one in New York City. Assume the location in California does experience, on average, one M = 6 every 10 years, compared to New York once every 1,000 years. This implies a ratio of rates of seismicity of 100:1. Does that mean the ratio of expected losses (when annualized per year) is also 100:1? Most likely not. That ratio may be closer to 10:1, which seems to imply that taking our clues from seismicity alone may lead to an underestimation of the potential seismic risks in the east. Why should this be so?
To check the assertion, let us make a back-of-the-envelope estimate. The expected seismic risk for a given area is defined as the area-integrated product of: seismic hazard (expected shaking level), assets ($ and people), and the assets’ vulnerabilities (that is, their expected fractional loss given a certain hazard – say, shaking level). Thus, if we have a 100 times lower seismicity rate in New York compared to California, which at any given point from a given quake may yield a 2 times higher shaking level in New York compared to California because ground motions in the east are known to differ from those in the west; and if we have a 2 times higher asset density (a modest assumption for Manhattan!), and a 2 times higher vulnerability (again a modest assumption when considering the large stock of unreinforced masonry buildings and aged infrastructure in New York), then our California/New York ratio for annualized loss potential may be on the order of (100/(2x2x2)):1. That implies about a 12:1 risk ratio between the California and New York location, compared to a 100:1 ratio in seismicity rates.
From this example it appears that seismic awareness in the east may be more controlled by the rate of seismicity than by the less well understood risk potential. This misunderstanding is one of the reasons why earthquake awareness and preparedness in the densely populated east is so disproportionally low relative to its seismic loss potential. Rare but potentially catastrophic losses in the east compete in attention with more frequent moderate losses in the west. New York City is the paramount example of a low-probability, high-impact seismic risk, the sort of risk that is hard to insure against, or mobilize public action to reduce the risks.
There are basically two ways to respond. One is to do little and wait until one or more disastrous events occur. Then react to these – albeit disastrous – “windows of opportunity.” That is, pay after the unmitigated facts, rather than attempt to control their outcome. This is a high-stakes approach, considering the evolved state of the economy. The other approach is to invest in mitigation ahead of time, and use scientific knowledge and inference, education, technology transfer, and combine it with a mixture of regulatory and/or economic incentives to implement earthquake preparedness. The National Earthquake Hazard Reduction Program (NEHRP) has attempted the latter while much of the public tends to cling to the former of the two options. Realistic and reliable quantitative loss estimation techniques are essential to evaluate the relative merits of the two approaches.
This paper tries to bring into focus some of the seismological factors which are but one set of variables one needs for quantifying the earthquake loss potential in eastern U.S. urban regions. We use local and global analogs for illustrating possible scenario events in terms of risk. We also highlight some of the few local steps that have been undertaken towards mitigating against the eastern earthquake threat; and discuss priorities for future actions.

Tuesday, June 10, 2025

Real Risk, Few Precautions (Revelation 6:12)

        By WILLIAM K. STEVENS

Published: October 24, 1989
AN EARTHQUAKE as powerful as the one that struck northern California last week could occur almost anywhere along the East Coast, experts say. And if it did, it would probably cause far more destruction than the West Coast quake.
The chances of such an occurrence are much less in the East than on the West Coast. Geologic stresses in the East build up only a hundredth to a thousandth as fast as in California, and this means that big Eastern quakes are far less frequent. Scientists do not really know what the interval between them might be, nor are the deeper-lying geologic faults that cause them as accessible to study. So seismologists are at a loss to predict when or where they will strike.
But they do know that a temblor with a magnitude estimated at 7 on the Richter scale – about the same magnitude as last week’s California quake – devastated Charleston, S.C., in 1886. And after more than a decade of study, they also know that geologic structures similar to those that caused the Charleston quake exist all along the Eastern Seaboard.
For this reason, ”we can’t preclude that a Charleston-sized earthquake might occur anywhere along the East Coast,” said David Russ, the assistant chief geologist of the United States Geological Survey in Reston, Va. ”It could occur in Washington. It could occur in New York.”
If that happens, many experts agree, the impact will probably be much greater than in California.Easterners, unlike Californians, have paid very little attention to making buildings and other structures earthquake-proof or earthquake-resistant. ”We don’t have that mentality here on the East Coast,” said Robert Silman, a New York structural engineer whose firm has worked on 3,800 buildings in the metropolitan area.
Moreover, buildings, highways, bridges, water and sewer systems and communications networks in the East are all older than in the West and consequently more vulnerable to damage. Even under normal conditions, for instance, water mains routinely rupture in New York City.
The result, said Dr. John Ebel, a geophysicist who is the assistant director of Boston College’s Weston Observatory, is that damage in the East would probably be more widespread, more people could be hurt and killed, depending on circumstances like time of day, and ”it would probably take a lot longer to get these cities back to useful operating levels.”
On top of this, scientists say, an earthquake in the East can shake an area 100 times larger than a quake of the same magnitude in California. This is because the earth’s crust is older, colder and more brittle in the East and tends to transmit seismic energy more efficiently. ”If you had a magnitude 7 earthquake and you put it halfway between New York City and Boston,” Dr. Ebel said, ”you would have the potential of doing damage in both places,” not to mention cities like Hartford and Providence.
Few studies have been done of Eastern cities’ vulnerability to earthquakes. But one, published last June in The Annals of the New York Academy of Sciences, calculated the effects on New York City of a magnitude 6 earthquake. That is one-tenth the magnitude of last week’s California quake, but about the same as the Whittier, Calif., quake two years ago.
The study found that such an earthquake centered 17 miles southeast of City Hall, off Rockaway Beach, would cause $11 billion in damage to buildings and start 130 fires. By comparison, preliminary estimates place the damage in last week’s California disaster at $4 billion to $10 billion. If the quake’s epicenter were 11 miles southeast of City Hall, the study found, there would be about $18 billion in damage; if 5 miles, about $25 billion.
No estimates on injuries or loss of life were made. But a magnitude 6 earthquake ”would probably be a disaster unparalleled in New York history,” wrote the authors of the study, Charles Scawthorn and Stephen K. Harris of EQE Engineering in San Francisco.
The study was financed by the National Center for Earthquake Engineering Research at the State University of New York at Buffalo. The research and education center, supported by the National Science Foundation and New York State, was established in 1986 to help reduce damage and loss of life from earthquakes.
The study’s postulated epicenter of 17 miles southeast of City Hall was the location of the strongest quake to strike New York since it has been settled, a magnitude 5 temblor on Aug. 10, 1884. That 1884 quake rattled bottles and crockery in Manhattan and frightened New Yorkers, but caused little damage. Seismologists say a quake of that order is likely to occur within 50 miles of New York City every 300 years. Quakes of magnitude 5 are not rare in the East. The major earthquake zone in the eastern half of the country is the central Mississippi Valley, where a huge underground rift causes frequent geologic dislocations and small temblors. The most powerful quake ever known to strike the United States occurred at New Madrid, Mo., in 1812. It was later estimated at magnitude 8.7 and was one of three quakes to strike that area in 1811-12, all of them stronger than magnitude 8. They were felt as far away as Washington, where they rattled chandeliers, Boston and Quebec.
Because the New Madrid rift is so active, it has been well studied, and scientists have been able to come up with predictions for the central Mississippi valley, which includes St. Louis and Memphis. According to Dr. Russ, there is a 40 to 63 percent chance that a quake of magnitude 6 will strike that area between now and the year 2000, and an 86 to 97 percent chance that it will do so by 2035. The Federal geologists say there is a 1 percent chance or less of a quake greater than magnitude 7 by 2000, and a 4 percent chance or less by 2035.
Elsewhere in the East, scientists are limited in their knowledge of probabilities partly because faults that could cause big earthquakes are buried deeper in the earth’s crust. In contrast to California, where the boundary between two major tectonic plates creates the San Andreas and related faults, the eastern United States lies in the middle of a major tectonic plate. Its faults are far less obvious, their activity far more subtle, and their slippage far slower. 
Any large earthquake would be ”vastly more serious” in the older cities of the East than in California,  said Dr. Tsu T. Soong, a professor of civil engineering at the State University of New York at Buffalo who is a researcher in earthquake-mitigation technology at the National Center for Earthquake Engineering Research. First, he said, many buildings are simply older, and therefore weaker and more  vulnerable to collapse. Second, there is no seismic construction code in most of the East as there is in California, where such codes have been in place for decades.
The vulnerability is evident in many ways. ”I’m sitting here looking out my window,” said Mr. Silman, the structural engineer in New York, ”and I see a bunch of water tanks all over the place” on rooftops. ”They are not anchored down at all, and it’s very possible they would fall in an earthquake.”
 Many brownstones, he said, constructed as they are of unreinforced masonry walls with wood joists between, ”would just go like a house of cards.” Unreinforced masonry, in fact, is the single most vulnerable structure, engineers say. Such buildings are abundant, even predominant, in many older cities. The Scawthorn-Harris study reviewed inventories of all buildings in Manhattan as of 1972 and found that 28,884, or more than half, were built of unreinforced masonry. Of those, 23,064 were three to five stories high.
Buildings of reinforced masonry, reinforced concrete and steel would hold up much better, engineers say, and wooden structures are considered intrinsically tough in ordinary circumstances. The best performers, they say, would probably be skyscrapers built in the last 20 years. As Mr. Silman explained, they have been built to withstand high winds, and the same structural features that enable them to do so also help them resist an earthquake’s force. But even these new towers have not been provided with the seismic protections required in California and so are more vulnerable than similar structures on the West Coast.
Buildings in New York are not generally constructed with such seismic protections as base-isolated structures, in which the building is allowed to shift with the ground movement; or with flexible frames that absorb and distribute energy through columns and beams so that floors can flex from side to side, or with reinforced frames that help resist distortion.
”If you’re trying to make a building ductile – able to absorb energy – we’re not geared to think that way,” said Mr. Silman.
New York buildings also contain a lot of decorative stonework, which can be dislodged and turned into lethal missiles by an earthquake. In California, building codes strictly regulate such architectural details.
Manhattan does, however, have at least one mitigating factor: ”We are blessed with this bedrock island,” said Mr. Silman. ”That should work to our benefit; we don’t have shifting soils. But there are plenty of places that are problem areas, particularly the shoreline areas,” where landfills make the ground soft and unstable.
As scientists have learned more about geologic faults in the Northeast, the nation’s uniform building code – the basic, minimum code followed throughout the country – has been revised accordingly. Until recently, the code required newly constructed buildings in New York City to withstand at least 19 percent of the side-to-side seismic force that a comparable building in the seismically active areas of California must handle. Now the threshold has been raised to 25 percent.
New York City, for the first time, is moving to adopt seismic standards as part of its own building code. Local and state building codes can and do go beyond the national code. Charles M. Smith Jr., the city Building Commissioner, last spring formed a committee of scientists, engineers, architects and government officials to recommend the changes.
”They all agree that New York City should anticipate an earthquake,” Mr. Smith said. As to how big an earthquake, ”I don’t think anybody would bet on a magnitude greater than 6.5,” he said. ”I don’t know,” he added, ”that our committee will go so far as to acknowledge” the damage levels in the Scawthorn-Harris study, characterizing it as ”not without controversy.”
For the most part, neither New York nor any other Eastern city has done a detailed survey of just how individual buildings and other structures would be affected, and how or whether to modify them.
”The thing I think is needed in the East is a program to investigate all the bridges” to see how they would stand up to various magnitudes of earthquake,” said Bill Geyer, the executive vice president of the New York engineering firm of Steinman, Boynton, Gronquist and Birdsall, which is rehabilitating the cable on the Williamsburg Bridge. ”No one has gone through and done any analysis of the existing bridges.”
In general, he said, the large suspension bridges, by their nature, ”are not susceptible to the magnitude of earthquake you’d expect in the East.” But the approaches and side spans of some of them might be, he said, and only a bridge-by-bridge analysis would tell. Nor, experts say, are some elevated highways in New York designed with the flexibility and ability to accommodate motion that would enable them to withstand a big temblor.
Tunnels Vulnerable
The underground tunnels that carry travelers under the rivers into Manhattan, those that contain the subways and those that carry water, sewers and natural gas would all be vulnerable to rupture, engineers say. The Lincoln, Holland, PATH and Amtrak tunnels, for instance, go from bedrock in Manhattan to soft soil under the Hudson River to bedrock again in New Jersey, said Mark Carter, a partner in Raamot Associates, geotechnical engineers specializing in soils and foundations.
Likewise, he said, subway tunnels between Manhattan and Queens go from hard rock to soft soil to hard rock on Roosevelt Island, to soft soil again and back to rock. The boundaries between soft soil and rock are points of weakness, he said.
”These structures are old,” he said, ”and as far as I know they have not been designed for earthquake loadings.”
Even if it is possible to survey all major buildings and facilities to determine what corrections can be made, cities like New York would then face a major decision: Is it worth spending the money to modify buildings and other structures to cope with a quake that might or might not come in 100, or 200 300 years or more?
”That is a classical problem” in risk-benefit analysis, said Dr. George Lee, the acting director of the Earthquake Engineering Research Center in Buffalo. As more is learned about Eastern earthquakes, he said, it should become ”possible to talk about decision-making.” But for now, he said, ”I think it’s premature for us to consider that question.”

Saturday, June 7, 2025

Why We Are In Trouble At The Sixth Seal (Revelation 6:12)


Dave Lochbaum
This is the second in a series of commentaries about the vital role nuclear safety inspections conducted by the Nuclear Regulatory Commission (NRC) play in protecting the public. The initial commentary described how NRC inspectors discovered that limits on the maximum allowable control room air temperature at the Columbia Generating Station in Washington had been improperly relaxed by the plant’s owner. This commentary describes a more recent finding by NRC inspectors about animproper safety assessment of a leaking cooling water system pipe on Entergy’s Unit 3 reactor at Indian Point outside New York City.
Indian Point Unit 3: Leak Before Break
On February 3, 2017, the NRC issued Indian Point a Green finding for a violation of Appendix B to 10 CFR Part 50. Specifically, the owner failed to perform an adequate operability review per its procedures after workers discovered water leaking from a service water system pipe.
On April 27, 2016, workers found water leaking from the pipe downstream of the strainer for service water (SW) pump 31. As shown in Figure 1, SW pump 31 is one of six service water pumps located within the intake structure alongside the Hudson River. The six SW pumps are arranged in two sets of three pumps. Figure 1 shows SW pumps 31, 32, and 33 aligned to provide water drawn from the Hudson River to essential (i.e, safety and emergency) components within Unit 3. SW pumps 34, 35, and 36 are aligned to provide cooling water to non-essential equipment within Unit 3.
Fig. 1 (Source: Nuclear Regulatory Commission Plant Information Book) (click to enlarge)
Each SW pump is designed to deliver 6,000 gallons of flow. During normal operation, one SW pump can handle the essential loads while two SW pumps are needed for the non-essential loads. Under accident conditions, two SW pumps are needed to cool the essential equipment. The onsite emergency diesel generators can power either of the sets of three pumps, but not both simultaneously. If the set of SW pumps aligned to the essential equipment aren’t getting the job done, workers can open/close valves and electrical breakers to reconfigure the second set of three SW pumps to the essential equipment loops.
Because river water can have stuff in it that could clog some of the coolers for essential equipment, each SW pump has a strainer that attempts to remove as much debris as possible from the water. The leak discovered on April 27, 2016, was in the piping between the discharge check valve for SW pump 31 and its strainer. An arrow points to this piping section in Figure 1. The strainers were installed in openings called pits in the thick concrete floor of the intake structure. Water from the leaking pipe flowed into the pit housing the strainer for SW pump 31.
The initial leak rate was modest—estimated to be about one-eighth of a gallon per minute. The leak was similar to other pinhole leaks that had occurred in the concrete-lined, carbon steel SW pipes. The owner began daily checks on the leakage and prepared an operability determination. Basically, “operability determinations” are used within the nuclear industry when safety equipment is found to be impaired or degraded. The operability determination for the service water pipe leak concluded that the impairment did not prevent the SW pumps from fulfilling their required safety function. The operability determination relied on a sump pump located at the bottom of the strainer pit transferring the leaking water out of the pit before the water flooded and submerged safety components.
The daily checks instituted by the owner included workers recording the leak rate and assessing whether it had significantly increased. But the checks were against the previous day’s leak rate rather than the initial leak rate. By September 18, 2016, the leakage had steadily increased by a factor of 64 to 8 gallons per minute. But the daily incremental increases were small enough that they kept workers from finding the overall increase to be significant.
The daily check on October 15, 2016, found the pump room flooded to a depth of several inches. The leak rate was now estimated to be 20 gallons per minute. And the floor drain in the strainer pit was clogged (ironic, huh?) impairing the ability of its sump pump to remove the water. Workers placed temporary sump pumps in the room to remove the flood water and cope with the insignificantly higher leak rate. On October 17, workers installed a clamp on the pipe that reduced the leakage to less than one gallon per minute.
The operability determination was revised in response to concerns expressed by the NRC inspectors. The NRC inspectors were not satisfied by the revised operability determination. It continued to rely on the strainer pit sump pump removing the leaking water. But that sump pump was not powered from the emergency diesel generator and thus would not remove water should offsite power become unavailable. Step 5.6.4 of procedure EN-OP-14, “Operability Determination Process,” stated “If the Operability is based on the use or availability of other equipment, it must be verified that the equipment is capable of performing the function utilized in the evaluation.”
The operability determination explicitly stated that no compensatory measures or operator manual actions were needed to handle the leak, but the situation clearly required both compensatory measures and operator manual actions.
The NRC inspectors found additional deficiencies in the revised operability determination. The NRC inspectors calculated that a 20 gallon per minute leak rate coupled with an unavailable strainer pit sump pump would flood the room to a depth of three feet in three hours. There are no flood alarms in the room and the daily checks might not detect flooding until the level rose to three feet. At that level, water would submerge and potentially disable the vacuum breakers for the SW pumps. Proper vacuum breaker operation could be needed to successfully restart the SW pumps.
The NRC inspectors calculated that the 20 gallon per minute leak rate without remediation would flood the room to the level of the control cabinets for the strainers in 10 hours. The submerged control cabinets could disable the strainers, leading to blocked cooling water flow to essential equipment.
The NRC inspects calculated that the 20 gallon per minute leak rate without remediation would completely fill the room in about 29 hours, or only slightly longer than the daily check interval.
Flooding to depths of 3 feet, 10 feet, and the room’s ceiling affected all six SW pumps. Thus, the flooding represented a common mode threat that could disable the entire service water system. In turn, all safety equipment shown in Figure 2 no longer cooled by the disabled service water system could also be disabled. The NRC estimated that the flooding risk was about 5×10⁻⁶ per reactor year, solidly in the Green finding band.
Fig. 2 (Source: Nuclear Regulatory Commission Plant Information Book) (click to enlarge)
UCS Perspective
“Leak before break” is a longstanding nuclear safety philosophy. Books have been written about it (well, at least one report has been written and may even have been read.)  The NRC’s approval of a leak before break analysis can allow the owner of an existing nuclear power reactor to remove pipe whip restraints and jet impingement barriers. Such hardware guarded against the sudden rupture of a pipe filled with high pressure fluid from damaging safety equipment in the area. The leak before break analyses can provide the NRC with sufficient confidence that piping degradation will be detected by observed leakage with remedial actions taken before the pipe fails catastrophically. More than a decade ago, the NRC issued a Knowledge Management document on the leak before break philosophy and acceptable methods of analyzing, monitoring, and responding to piping degradation.
This incident at Indian Point illustrated an equally longstanding nuclear safety practice of “leak before break.” In this case, the leak was indeed followed by a break. But the break was not the failure of the piping but failure of the owner to comply with federal safety regulations. Pipe breaks are bad. Regulation breaks are bad. Deciding which is worse is like trying to decide which eye one wants to be poked in. None is far better than either.
As with the prior Columbia Generating Station case study, this Indian Point case study illustrates the vital role that NRC’s enforcement efforts plays in nuclear safety. Even after NRC inspectors voiced clear concerns about the improperly evaluated service water system pipe leak, Entergy failed to properly evaluate the situation, thus violating federal safety regulations. To be fair to Entergy, the company was probably doing its best, but in recent years, Entergy’s best has been far below nuclear industry average performance levels.
The NRC’s ROP is the public’s best protection against hazards caused by aging nuclear power reactors, shrinking maintenance budgets, emerging sabotage threats, and Entergy.Replacing the NRC’s engineering inspections with self-assessments by Entergy would lessen the effectiveness of that protective shield.
The NRC must continue to protect the public to the best of its ability. Delegating safety checks to owners like Entergy is inconsistent with that important mission.

Support from UCS members make work like this possible. Will you join us? Help UCS advance independent science for a healthy environment and a safer world.he Hudson River. The six SW pumps are arranged in two sets of three pumps. Figure 1 shows SW pumps 31, 32, and 33 aligned to provide water drawn from the Hudson River to essential (i.e, safety and emergency) components within Unit 3. SW pumps 34, 35, and 36 are aligned to provide cooling water to non-essential equipment within Unit 3. Fig. 1 (Source: Nuclear Regulatory Commission Plant Information Book) (click to enlarge) Each SW pump is designed to deliver 6,000 gallons of flow. During normal operation, one SW pump can handle the essential loads while two SW pumps are needed for the non-essential loads. Under accident conditions, two SW pumps are needed to cool the essential equipment. The onsite emergency diesel generators can power either of the sets of three pumps, but not both simultaneously. If the set of SW pumps aligned to the essential equipment aren’t getting the job done, workers can open/close valves and electrical breakers to reconfigure the second set of three SW pumps to the essential equipment loops. Because river water can have stuff in it that could clog some of the coolers for essential equipment, each SW pump has a strainer that attempts to remove as much debris as possible from the water. The leak discovered on April 27, 2016, was in the piping between the discharge check valve for SW pump 31 and its strainer. An arrow points to this piping section in Figure 1. The strainers were installed in openings called pits in the thick concrete floor of the intake structure. Water from the leaking pipe flowed into the pit housing the strainer for SW pump 31. The initial leak rate was modest—estimated to be about one-eighth of a gallon per minute. The leak was similar to other pinhole leaks that had occurred in the concrete-lined, carbon steel SW pipes. The owner began daily checks on the leakage and prepared an operability determination. Basically, “operability determinations” are used within the nuclear industry when safety equipment is found to be impaired or degraded. The operability determination for the service water pipe leak concluded that the impairment did not prevent the SW pumps from fulfilling their required safety function. The operability determination relied on a sump pump located at the bottom of the strainer pit transferring the leaking water out of the pit before the water flooded and submerged safety components. The daily checks instituted by the owner included workers recording the leak rate and assessing whether it had significantly increased. But the checks were against the previous day’s leak rate rather than the initial leak rate. By September 18, 2016, the leakage had steadily increased by a factor of 64 to 8 gallons per minute. But the daily incremental increases were small enough that they kept workers from finding the overall increase to be significant. The daily check on October 15, 2016, found the pump room flooded to a depth of several inches. The leak rate was now estimated to be 20 gallons per minute. And the floor drain in the strainer pit was clogged (ironic, huh?) impairing the ability of its sump pump to remove the water. Workers placed temporary sump pumps in the room to remove the flood water and cope with the insignificantly higher leak rate. On October 17, workers installed a clamp on the pipe that reduced the leakage to less than one gallon per minute. The operability determination was revised in response to concerns expressed by the NRC inspectors. The NRC inspectors were not satisfied by the revised operability determination. It continued to rely on the strainer pit sump pump removing the leaking water. But that sump pump was not powered from the emergency diesel generator and thus would not remove water should offsite power become unavailable. Step 5.6.4 of procedure EN-OP-14, “Operability Determination Process,” stated “If the Operability is based on the use or availability of other equipment, it must be verified that the equipment is capable of performing the function utilized in the evaluation.” The operability determination explicitly stated that no compensatory measures or operator manual actions were needed to handle the leak, but the situation clearly required both compensatory measures and operator manual actions. The NRC inspectors found additional deficiencies in the revised operability determination. The NRC inspectors calculated that a 20 gallon per minute leak rate coupled with an unavailable strainer pit sump pump would flood the room to a depth of three feet in three hours. There are no flood alarms in the room and the daily checks might not detect flooding until the level rose to three feet. At that level, water would submerge and potentially disable the vacuum breakers for the SW pumps. Proper vacuum breaker operation could be needed to successfully restart the SW pumps. The NRC inspectors calculated that the 20 gallon per minute leak rate without remediation would flood the room to the level of the control cabinets for the strainers in 10 hours. The submerged control cabinets could disable the strainers, leading to blocked cooling water flow to essential equipment. The NRC inspects calculated that the 20 gallon per minute leak rate without remediation would completely fill the room in about 29 hours, or only slightly longer than the daily check interval. Flooding to depths of 3 feet, 10 feet, and the room’s ceiling affected all six SW pumps. Thus, the flooding represented a common mode threat that could disable the entire service water system. In turn, all safety equipment shown in Figure 2 no longer cooled by the disabled service water system could also be disabled. The NRC estimated that the flooding risk was about 5×10⁻⁶ per reactor year, solidly in the Green finding band. Fig. 2 (Source: Nuclear Regulatory Commission Plant Information Book) (click to enlarge) UCS Perspective “Leak before break” is a longstanding nuclear safety philosophy. Books have been written about it (well, at least one report has been written and may even have been read.) The NRC’s approval of a leak before break analysis can allow the owner of an existing nuclear power reactor to remove pipe whip restraints and jet impingement barriers. Such hardware guarded against the sudden rupture of a pipe filled with high pressure fluid from damaging safety equipment in the area. The leak before break analyses can provide the NRC with sufficient confidence that piping degradation will be detected by observed leakage with remedial actions taken before the pipe fails catastrophically. More than a decade ago, the NRC issued a Knowledge Management document on the leak before break philosophy and acceptable methods of analyzing, monitoring, and responding to piping degradation. This incident at Indian Point illustrated an equally longstanding nuclear safety practice of “leak before break.” In this case, the leak was indeed followed by a break. But the break was not the failure of the piping but failure of the owner to comply with federal safety regulations. Pipe breaks are bad. Regulation breaks are bad. Deciding which is worse is like trying to decide which eye one wants to be poked in. None is far better than either. As with the prior Columbia Generating Station case study, this Indian Point case study illustrates the vital role that NRC’s enforcement efforts plays in nuclear safety. Even after NRC inspectors voiced clear concerns about the improperly evaluated service water system pipe leak, Entergy failed to properly evaluate the situation, thus violating federal safety regulations. To be fair to Entergy, the company was probably doing its best, but in recent years, Entergy’s best has been far below nuclear industry average performance levels. The NRC’s ROP is the public’s best protection against hazards caused by aging nuclear power reactors, shrinking maintenance budgets, emerging sabotage threats, and Entergy.Replacing the NRC’s engineering inspections with self-assessments by Entergy would lessen the effectiveness of that protective shield. The NRC must continue to protect the public to the best of its ability. Delegating safety checks to owners like Entergy is inconsistent with that important mission. Support from UCS members make work like this possible. Will you join us? Help UCS advance independent science for a healthy environment and a safer world.

Wednesday, June 4, 2025

The History Of New York Earthquakes: Before The Sixth Seal (Revelation 6:12)


Historic Earthquakes
Near New York City, New York
1884 08 10 19:07 UTC
Magnitude 5.5The History Of New York Earthquakes: Before The Sixth Seal (Rev 6:12)
Intensity VII
USGS.gov
This severe earthquake affected an area roughly extending along the Atlantic Coast from southern Maine to central Virginia and westward to Cleveland, Ohio. Chimneys were knocked down and walls were cracked in several States, including Connecticut, New Jersey, New York, and Pennsylvania. Many towns from Hartford, Connecticut, to West Chester,Pennsylvania.
Property damage was severe at Amityville and Jamaica, New York, where several chimneys were “overturned” and large cracks formed in walls. Two chimneys were thrown down and bricks were shaken from other chimneys at Stratford (Fairfield County), Conn.; water in the Housatonic River was agitated violently. At Bloomfield, N.J., and Chester, Pa., several chimneys were downed and crockery was broken. Chimneys also were damaged at Mount Vernon, N.Y., and Allentown, Easton, and Philadelphia, Pa. Three shocks occurred, the second of which was most violent. This earthquake also was reported felt in Vermont, Virginia, and Washington, D.C. Several slight aftershocks were reported on August 11.
Teilen mit:
TwitterFacebook

Sunday, June 1, 2025

The Next Major Quake: The Sixth Seal of NYC: Revelation 6


A recent assessment by the USGS determined that the earthquake hazard along the East Coast may previously have been underestimated. The varying risks around the US can be seen above, with New York City in the mid-range (yellow)

New York is OVERDUE an earthquake from a ‚brittle grid‘ of faults under the city, expert warns

  • New York City last experienced a M5 or higher earthquake in 1884, experts say
  • It’s thought that these earthquakes occur on a roughly 150-year periodicity 
  • Based on this, some say the city could be overdue for the next major quake 
Published: 15:50 EDT, 1 September 2017 | Updated: 12:00 EDT, 2 September 2017
When you think of the impending earthquake risk in the United States, it’s likely California or the Pacific Northwest comes to mind.
But, experts warn a system of faults making up a ‘brittle grid’ beneath New York City could also be loading up for a massive temblor.
The city has been hit by major quakes in the past, along what’s thought to be roughly 150-year intervals, and researchers investigating these faults now say the region could be overdue for the next event.
Experts warn a system of faults making up a ‘brittle grid’ beneath New York City could also be loading up for a massive temblor. The city has been hit by major quakes in the past, along what’s thought to be roughly 150-year intervals. A stock image is pictured

THE ‚CONEY ISLAND EARTHQUAKE‘

On August 10, 1884, New York was struck by a magnitude 5.5 earthquake with an epicentre located in Brooklyn.
While there was little damage and few injuries reported, anecdotal accounts of the event reveal the frightening effects of the quake.
One newspaper even reported that it caused someone to die from fright.
According to a New York Times report following the quake, massive buildings, including the Post Office swayed back and forth.
And, police said they felt the Brooklyn Bridge swaying ‘as if struck by a hurricane,’ according to an adaptation of Kathryn Miles’ book Quakeland: On the Road to America’s Next Devastating Earthquake.
The rumbles were felt across a 70,000-square-mile area, causing broken windows and cracked walls as far as Pennsylvania and Connecticut.
The city hasn’t experienced an earthquake this strong since.
According to geologist Dr Charles Merguerian, who has walked the entirety of Manhattan to assess its seismicity, there are a slew of faults running through New York, reports author Kathryn Miles in an adaptation of her new book Quakeland: On the Road to America’s Next Devastating Earthquake.
One such fault passes through 125th street, otherwise known as the Manhattanville Fault.
While there have been smaller quakes in New York’s recent past, including a magnitude 2.6 that struck in October 2001, it’s been decades since the last major tremor of M 5 or more.
And, most worryingly, the expert says there’s no way to predict exactly when a quake will strike.
‘That’s a question you really can’t answer,’ Merguerian has explained in the past.
‘All we can do is look at the record, and the record is that there was a relatively large earthquake here in the city in 1737, and in 1884, and that periodicity is about 150 year heat cycle.
‘So you have 1737, 1884, 20- and, we’re getting there. But statistics can lie.
‘An earthquake could happen any day, or it couldn’t happen for 100 years, and you just don’t know, there’s no way to predict.’
Compared the other parts of the United States, the risk of an earthquake in New York may not seem as pressing.
But, experts explain that a quake could happen anywhere.
According to geologist Dr Charles Merguerian, there are a slew of faults running through NY. One is the Ramapo Fault
‘All states have some potential for damaging earthquake shaking,’ according to the US Geological Survey.
‘Hazard is especially high along the west coast but also in the intermountain west, and in parts of the central and eastern US.’
A recent assessment by the USGS determined that the earthquake hazard along the East Coast may previously have been underestimated.
‘The eastern U.S. has the potential for larger and more damaging earthquakes than considered in previous maps and assessments,’ the USGS report explained.
The experts point to a recent example – the magnitude 5.8 earthquake that hit Virginia in 2011, which was among the largest to occur on the east coast in the last century.
This event suggests the area could be subjected to even larger earthquakes, even raising the risk for Charleston, SC.
It also indicates that New York City may be at higher risk than once thought.
A recent assessment by the USGS determined that the earthquake hazard along the East Coast may previously have been underestimated. The varying risks around the US can be seen above, with New York City in the mid-range (yellow).