The prophecy is more than seeing into the future. For the prophecy sees without the element of time. For the prophecy sees things as they were, as they are, and as they always shall be.
Saturday, December 20, 2025
The Sixth Seal of NYC Long Overdue (Revelation 6)
Tuesday, October 28, 2025
The Next Major Quake: The Sixth Seal of NYC
New York is OVERDUE an earthquake from a ‚brittle grid‘ of faults under the city, expert warns
- New York City last experienced a M5 or higher earthquake in 1884, experts say
- It’s thought that these earthquakes occur on a roughly 150-year periodicity
- Based on this, some say the city could be overdue for the next major quake
THE ‚CONEY ISLAND EARTHQUAKE‘
Thursday, October 9, 2025
Economic Consequences of the Sixth Seal (Revelation 6:12)
NYCEM.org
If today a magnitude 6 earthquake were to occur centered on New York City, what would its effects be? Will the loss be 10 or 100 billion dollars? Will there be 10 or 10,000 fatalities? Will there be 1,000 or 100,000 homeless needing shelter? Can government function, provide assistance, and maintain order?
At this time, no satisfactory answers to these questions are available. A few years ago, rudimentary scenario studies were made for Boston and New York with limited scope and uncertain results. For most eastern cities, including Washington D.C., we know even less about the economic, societal and political impacts from significant earthquakes, whatever their rate of occurrence.
Why do we know so little about such vital public issues? Because the public has been lulled into believing that seriously damaging quakes are so unlikely in the east that in essence we do not need to consider them. We shall examine the validity of this widely held opinion.
Is the public’s earthquake awareness (or lack thereof) controlled by perceived low Seismicity, Seismic Hazard, or Seismic Risk? How do these three seismic features differ from, and relate to each other? In many portions of California, earthquake awareness is refreshed in a major way about once every decade (and in some places even more often) by virtually every person experiencing a damaging event. The occurrence of earthquakes of given magnitudes in time and space, not withstanding their effects, are the manifestations of seismicity. Ground shaking, faulting, landslides or soil liquefaction are the manifestations of seismic hazard. Damage to structures, and loss of life, limb, material assets, business and services are the manifestations of seismic risk. By sheer experience, California’s public understands fairly well these three interconnected manifestations of the earthquake phenomenon. This awareness is reflected in public policy, enforcement of seismic regulations, and preparedness in both the public and private sector. In the eastern U.S., the public and its decision makers generally do not understand them because of inexperience. Judging seismic risk by rates of seismicity alone (which are low in the east but high in the west) has undoubtedly contributed to the public’s tendency to belittle the seismic loss potential for eastern urban regions.
Let us compare two hypothetical locations, one in California and one in New York City. Assume the location in California does experience, on average, one M = 6 every 10 years, compared to New York once every 1,000 years. This implies a ratio of rates of seismicity of 100:1. Does that mean the ratio of expected losses (when annualized per year) is also 100:1? Most likely not. That ratio may be closer to 10:1, which seems to imply that taking our clues from seismicity alone may lead to an underestimation of the potential seismic risks in the east. Why should this be so?
To check the assertion, let us make a back-of-the-envelope estimate. The expected seismic risk for a given area is defined as the area-integrated product of: seismic hazard (expected shaking level), assets ($ and people), and the assets’ vulnerabilities (that is, their expected fractional loss given a certain hazard – say, shaking level). Thus, if we have a 100 times lower seismicity rate in New York compared to California, which at any given point from a given quake may yield a 2 times higher shaking level in New York compared to California because ground motions in the east are known to differ from those in the west; and if we have a 2 times higher asset density (a modest assumption for Manhattan!), and a 2 times higher vulnerability (again a modest assumption when considering the large stock of unreinforced masonry buildings and aged infrastructure in New York), then our California/New York ratio for annualized loss potential may be on the order of (100/(2x2x2)):1. That implies about a 12:1 risk ratio between the California and New York location, compared to a 100:1 ratio in seismicity rates.
From this example it appears that seismic awareness in the east may be more controlled by the rate of seismicity than by the less well understood risk potential. This misunderstanding is one of the reasons why earthquake awareness and preparedness in the densely populated east is so disproportionally low relative to its seismic loss potential. Rare but potentially catastrophic losses in the east compete in attention with more frequent moderate losses in the west. New York City is the paramount example of a low-probability, high-impact seismic risk, the sort of risk that is hard to insure against, or mobilize public action to reduce the risks.
There are basically two ways to respond. One is to do little and wait until one or more disastrous events occur. Then react to these – albeit disastrous – “windows of opportunity.” That is, pay after the unmitigated facts, rather than attempt to control their outcome. This is a high-stakes approach, considering the evolved state of the economy. The other approach is to invest in mitigation ahead of time, and use scientific knowledge and inference, education, technology transfer, and combine it with a mixture of regulatory and/or economic incentives to implement earthquake preparedness. The National Earthquake Hazard Reduction Program (NEHRP) has attempted the latter while much of the public tends to cling to the former of the two options. Realistic and reliable quantitative loss estimation techniques are essential to evaluate the relative merits of the two approaches.
This paper tries to bring into focus some of the seismological factors which are but one set of variables one needs for quantifying the earthquake loss potential in eastern U.S. urban regions. We use local and global analogs for illustrating possible scenario events in terms of risk. We also highlight some of the few local steps that have been undertaken towards mitigating against the eastern earthquake threat; and discuss priorities for future actions.
Wednesday, June 4, 2025
The History Of New York Earthquakes: Before The Sixth Seal (Revelation 6:12)

Historic Earthquakes
Near New York City, New York
1884 08 10 19:07 UTC
Magnitude 5.5The History Of New York Earthquakes: Before The Sixth Seal (Rev 6:12)
Intensity VII
USGS.gov
This severe earthquake affected an area roughly extending along the Atlantic Coast from southern Maine to central Virginia and westward to Cleveland, Ohio. Chimneys were knocked down and walls were cracked in several States, including Connecticut, New Jersey, New York, and Pennsylvania. Many towns from Hartford, Connecticut, to West Chester,Pennsylvania.
Property damage was severe at Amityville and Jamaica, New York, where several chimneys were “overturned” and large cracks formed in walls. Two chimneys were thrown down and bricks were shaken from other chimneys at Stratford (Fairfield County), Conn.; water in the Housatonic River was agitated violently. At Bloomfield, N.J., and Chester, Pa., several chimneys were downed and crockery was broken. Chimneys also were damaged at Mount Vernon, N.Y., and Allentown, Easton, and Philadelphia, Pa. Three shocks occurred, the second of which was most violent. This earthquake also was reported felt in Vermont, Virginia, and Washington, D.C. Several slight aftershocks were reported on August 11.
Teilen mit:
TwitterFacebook
Sunday, April 20, 2025
Why We Are In Trouble At The Sixth Seal (Revelation 6:12)


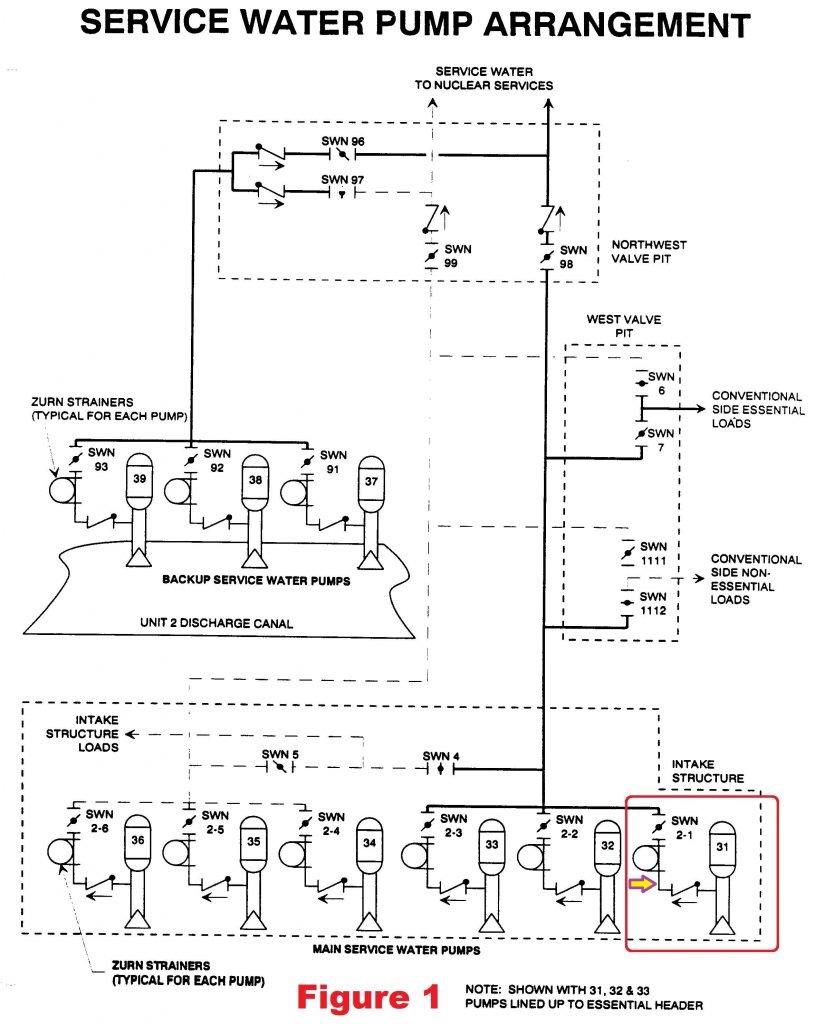
Support from UCS members make work like this possible. Will you join us? Help UCS advance independent science for a healthy environment and a safer world.he Hudson River. The six SW pumps are arranged in two sets of three pumps. Figure 1 shows SW pumps 31, 32, and 33 aligned to provide water drawn from the Hudson River to essential (i.e, safety and emergency) components within Unit 3. SW pumps 34, 35, and 36 are aligned to provide cooling water to non-essential equipment within Unit 3. Fig. 1 (Source: Nuclear Regulatory Commission Plant Information Book) (click to enlarge) Each SW pump is designed to deliver 6,000 gallons of flow. During normal operation, one SW pump can handle the essential loads while two SW pumps are needed for the non-essential loads. Under accident conditions, two SW pumps are needed to cool the essential equipment. The onsite emergency diesel generators can power either of the sets of three pumps, but not both simultaneously. If the set of SW pumps aligned to the essential equipment aren’t getting the job done, workers can open/close valves and electrical breakers to reconfigure the second set of three SW pumps to the essential equipment loops. Because river water can have stuff in it that could clog some of the coolers for essential equipment, each SW pump has a strainer that attempts to remove as much debris as possible from the water. The leak discovered on April 27, 2016, was in the piping between the discharge check valve for SW pump 31 and its strainer. An arrow points to this piping section in Figure 1. The strainers were installed in openings called pits in the thick concrete floor of the intake structure. Water from the leaking pipe flowed into the pit housing the strainer for SW pump 31. The initial leak rate was modest—estimated to be about one-eighth of a gallon per minute. The leak was similar to other pinhole leaks that had occurred in the concrete-lined, carbon steel SW pipes. The owner began daily checks on the leakage and prepared an operability determination. Basically, “operability determinations” are used within the nuclear industry when safety equipment is found to be impaired or degraded. The operability determination for the service water pipe leak concluded that the impairment did not prevent the SW pumps from fulfilling their required safety function. The operability determination relied on a sump pump located at the bottom of the strainer pit transferring the leaking water out of the pit before the water flooded and submerged safety components. The daily checks instituted by the owner included workers recording the leak rate and assessing whether it had significantly increased. But the checks were against the previous day’s leak rate rather than the initial leak rate. By September 18, 2016, the leakage had steadily increased by a factor of 64 to 8 gallons per minute. But the daily incremental increases were small enough that they kept workers from finding the overall increase to be significant. The daily check on October 15, 2016, found the pump room flooded to a depth of several inches. The leak rate was now estimated to be 20 gallons per minute. And the floor drain in the strainer pit was clogged (ironic, huh?) impairing the ability of its sump pump to remove the water. Workers placed temporary sump pumps in the room to remove the flood water and cope with the insignificantly higher leak rate. On October 17, workers installed a clamp on the pipe that reduced the leakage to less than one gallon per minute. The operability determination was revised in response to concerns expressed by the NRC inspectors. The NRC inspectors were not satisfied by the revised operability determination. It continued to rely on the strainer pit sump pump removing the leaking water. But that sump pump was not powered from the emergency diesel generator and thus would not remove water should offsite power become unavailable. Step 5.6.4 of procedure EN-OP-14, “Operability Determination Process,” stated “If the Operability is based on the use or availability of other equipment, it must be verified that the equipment is capable of performing the function utilized in the evaluation.” The operability determination explicitly stated that no compensatory measures or operator manual actions were needed to handle the leak, but the situation clearly required both compensatory measures and operator manual actions. The NRC inspectors found additional deficiencies in the revised operability determination. The NRC inspectors calculated that a 20 gallon per minute leak rate coupled with an unavailable strainer pit sump pump would flood the room to a depth of three feet in three hours. There are no flood alarms in the room and the daily checks might not detect flooding until the level rose to three feet. At that level, water would submerge and potentially disable the vacuum breakers for the SW pumps. Proper vacuum breaker operation could be needed to successfully restart the SW pumps. The NRC inspectors calculated that the 20 gallon per minute leak rate without remediation would flood the room to the level of the control cabinets for the strainers in 10 hours. The submerged control cabinets could disable the strainers, leading to blocked cooling water flow to essential equipment. The NRC inspects calculated that the 20 gallon per minute leak rate without remediation would completely fill the room in about 29 hours, or only slightly longer than the daily check interval. Flooding to depths of 3 feet, 10 feet, and the room’s ceiling affected all six SW pumps. Thus, the flooding represented a common mode threat that could disable the entire service water system. In turn, all safety equipment shown in Figure 2 no longer cooled by the disabled service water system could also be disabled. The NRC estimated that the flooding risk was about 5×10⁻⁶ per reactor year, solidly in the Green finding band. Fig. 2 (Source: Nuclear Regulatory Commission Plant Information Book) (click to enlarge) UCS Perspective “Leak before break” is a longstanding nuclear safety philosophy. Books have been written about it (well, at least one report has been written and may even have been read.) The NRC’s approval of a leak before break analysis can allow the owner of an existing nuclear power reactor to remove pipe whip restraints and jet impingement barriers. Such hardware guarded against the sudden rupture of a pipe filled with high pressure fluid from damaging safety equipment in the area. The leak before break analyses can provide the NRC with sufficient confidence that piping degradation will be detected by observed leakage with remedial actions taken before the pipe fails catastrophically. More than a decade ago, the NRC issued a Knowledge Management document on the leak before break philosophy and acceptable methods of analyzing, monitoring, and responding to piping degradation. This incident at Indian Point illustrated an equally longstanding nuclear safety practice of “leak before break.” In this case, the leak was indeed followed by a break. But the break was not the failure of the piping but failure of the owner to comply with federal safety regulations. Pipe breaks are bad. Regulation breaks are bad. Deciding which is worse is like trying to decide which eye one wants to be poked in. None is far better than either. As with the prior Columbia Generating Station case study, this Indian Point case study illustrates the vital role that NRC’s enforcement efforts plays in nuclear safety. Even after NRC inspectors voiced clear concerns about the improperly evaluated service water system pipe leak, Entergy failed to properly evaluate the situation, thus violating federal safety regulations. To be fair to Entergy, the company was probably doing its best, but in recent years, Entergy’s best has been far below nuclear industry average performance levels. The NRC’s ROP is the public’s best protection against hazards caused by aging nuclear power reactors, shrinking maintenance budgets, emerging sabotage threats, and Entergy.Replacing the NRC’s engineering inspections with self-assessments by Entergy would lessen the effectiveness of that protective shield. The NRC must continue to protect the public to the best of its ability. Delegating safety checks to owners like Entergy is inconsistent with that important mission. Support from UCS members make work like this possible. Will you join us? Help UCS advance independent science for a healthy environment and a safer world.

Thursday, March 20, 2025
The Trend Leading to the Sixth Seal (Revelation 6:12)
Thursday, January 30, 2025
USGS Evidence Shows Power of the Sixth Seal (Revelation 6:12)
New Evidence Shows Power of East Coast Earthquakes
Virginia Earthquake Triggered Landslides at Great Distances
Sunday, January 26, 2025
The Trend Leading to the Sixth Seal (Revelation 6:12)
East Coast Still Unprepared For The Sixth Seal (Revelation 6:12)
East Coast Earthquake Preparedness
By By BEN NUCKOLS
Posted: 08/25/2011 8:43 am EDT
WASHINGTON — There were cracks in the Washington Monument and broken capstones at the National Cathedral. In the District of Columbia suburbs, some people stayed in shelters because of structural concerns at their apartment buildings.
A day after the East Coast’s strongest earthquake in 67 years, inspectors assessed the damage and found that most problems were minor. But the shaking raised questions about whether this part of the country, with its older architecture and inexperience with seismic activity, is prepared for a truly powerful quake.
The 5.8 magnitude quake felt from Georgia north to Canada prompted swift inspections of many structures Wednesday, including bridges and nuclear plants. An accurate damage estimate could take weeks, if not longer. And many people will not be covered by insurance.
In a small Virginia city near the epicenter, the entire downtown business district was closed. School was canceled for two weeks to give engineers time to check out cracks in several buildings.
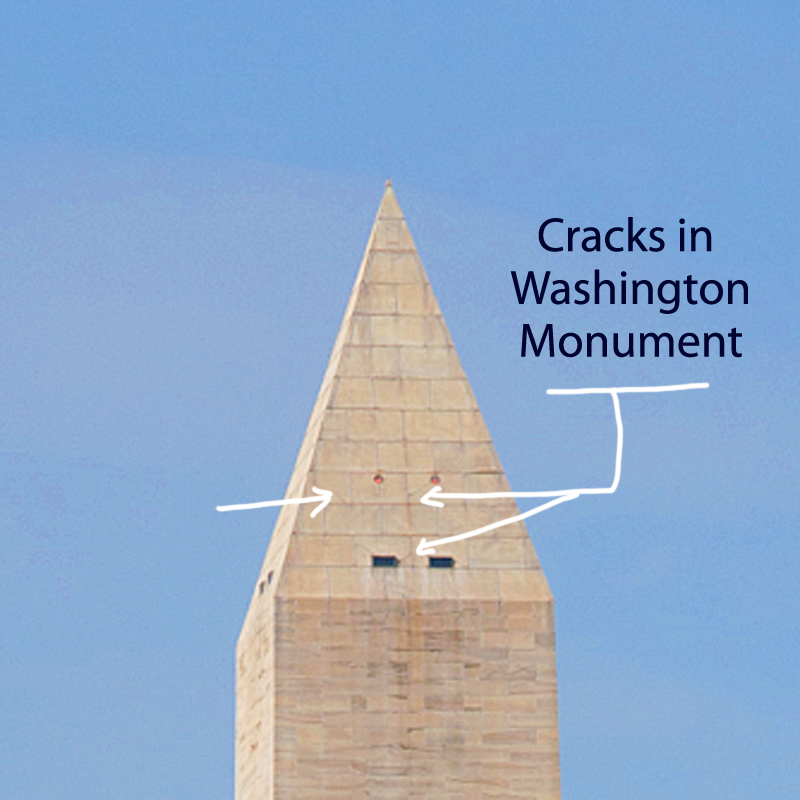
At the 555-foot Washington Monument, inspectors found several cracks in the pyramidion – the section at the top of the obelisk where it begins narrowing to a point.
A 4-foot crack was discovered Tuesday during a visual inspection by helicopter. It cannot be seen from the ground. Late Wednesday, the National Park Service announced that structural engineers had found several additional cracks inside the top of the monument.
Carol Johnson, a park service spokeswoman, could not say how many cracks were found but said three or four of them were “significant.” Two structural engineering firms that specialize in assessing earthquake damage were being brought in to conduct a more thorough inspection on Thursday.
The monument, by far the tallest structure in the nation’s capital, was to remain closed indefinitely, and Johnson said the additional cracks mean repairs are likely to take longer. It has never been damaged by a natural disaster, including earthquakes in Virginia in 1897 and New York in 1944.
Tourists arrived at the monument Wednesday morning only to find out they couldn’t get near it. A temporary fence was erected in a wide circle about 120 feet from the flags that surround its base. Walkways were blocked by metal barriers manned by security guards.
“Is it really closed?” a man asked the clerk at the site’s bookstore.
“It’s really closed,” said the clerk, Erin Nolan. Advance tickets were available for purchase, but she cautioned against buying them because it’s not clear when the monument will open.
“This is pretty much all I’m going to be doing today,” Nolan said.
Tuesday’s quake was centered about 40 miles northwest of Richmond, 90 miles south of Washington and 3.7 miles underground. In the nearby town of Mineral, Va., Michael Leman knew his Main Street Plumbing & Electrical Supply business would need – at best – serious and expensive repairs.
At worst, it could be condemned. The facade had become detached from the rest of the building, and daylight was visible through a 4- to 6-inch gap that opened between the front wall and ceiling.
“We’re definitely going to open back up,” Leman said. “I’ve got people’s jobs to look out for.”
Leman said he is insured, but some property owners might not be so lucky.
The Insurance Information Institute said earthquakes are not covered under standard U.S. homeowners or business insurance policies, although supplemental coverage is usually available.
The institute says coverage for other damage that may result from earthquakes, such as fire and water damage from burst gas or water pipes, is provided by standard homeowners and business insurance policies in most states. Cars and other vehicles with comprehensive insurance would also be protected.
The U.S. Geological Survey classified the quake as Alert Level Orange, the second-most serious category on its four-level scale. Earthquakes in that range lead to estimated losses between $100 million and $1 billion.
In Culpeper, Va., about 35 miles from the epicenter, walls had buckled at the old sanctuary at St. Stephen’s Episcopal Church, which was constructed in 1821 and drew worshippers including Confederate Gens. Robert E. Lee and J.E.B. Stuart. Heavy stone ornaments atop a pillar at the gate were shaken to the ground. A chimney from the old Culpeper Baptist Church built in 1894 also tumbled down.
At the Washington National Cathedral, spokesman Richard Weinberg said the building’s overall structure remains sound and damage was limited to “decorative elements.”
Massive stones atop three of the four spires on the building’s central tower broke off, crashing onto the roof. At least one of the spires is teetering badly, and cracks have appeared in some flying buttresses.
Repairs were expected to cost millions of dollars – an expense not covered by insurance.
“Every single portion of the exterior is carved by hand, so everything broken off is a piece of art,” Weinberg said. “It’s not just the labor, but the artistry of replicating what was once there.”
The building will remain closed as a precaution. Services to dedicate the memorial honoring Rev. Martin Luther King Jr. were moved.
Other major cities along the East Coast that felt the shaking tried to gauge the risk from another quake.
A few hours after briefly evacuating New York City Hall, Mayor Michael Bloomberg said the city’s newer buildings could withstand a more serious earthquake. But, he added, questions remain about the older buildings that are common in a metropolis founded hundreds of years ago.
“We think that the design standards of today are sufficient against any eventuality,” he said. But “there are questions always about some very old buildings. … Fortunately those tend to be low buildings, so there’s not great danger.”
An earthquake similar to the one in Virginia could do billions of dollars of damage if it were centered in New York, said Barbara Nadel, an architect who specializes in securing buildings against natural disasters and terrorism.
The city’s 49-page seismic code requires builders to prepare for significant shifting of the earth. High-rises must be built with certain kinds of bracing, and they must be able to safely sway at least somewhat to accommodate for wind and even shaking from the ground, Nadel said.
Buildings constructed in Boston in recent decades had to follow stringent codes comparable to anything in California, said Vernon Woodworth, an architect and faculty member at the Boston Architectural College. New construction on older structures also must meet tough standards to withstand severe tremors, he said.
It’s a different story with the city’s older buildings. The 18th- and 19th-century structures in Boston’s Back Bay, for instance, were often built on fill, which can liquefy in a strong quake, Woodworth said. Still, there just aren’t many strong quakes in New England.
The last time the Boston area saw a quake as powerful as the one that hit Virginia on Tuesday was in 1755, off Cape Ann, to the north. A repeat of that quake would likely cause deaths, Woodworth said. Still, the quakes are so infrequent that it’s difficult to weigh the risks versus the costs of enacting tougher building standards regionally, he said.
People in several of the affected states won’t have much time to reflect before confronting another potential emergency. Hurricane Irene is approaching the East Coast and could skirt the Mid-Atlantic region by the weekend and make landfall in New England after that.
In North Carolina, officials were inspecting an aging bridge that is a vital evacuation route for people escaping the coastal barrier islands as the storm approaches.
Speaking at an earthquake briefing Wednesday, Washington Mayor Vincent Gray inadvertently mixed up his disasters.
“Everyone knows, obviously, that we had a hurricane,” he said before realizing his mistake.
“Hurricane,” he repeated sheepishly as reporters and staffers burst into laughter. “I’m getting ahead of myself!”
___
Associated Press writers Sam Hananel in Washington; Alex Dominguez in Baltimore; Bob Lewis in Mineral, Va.; Samantha Gross in New York City; and Jay Lindsay in Boston contributed to this report.
Thursday, January 23, 2025
Preparing for the Sixth Seal (Revelation 6:12)
Scenario Earthquakes for Urban Areas Along the Atlantic Seaboard of the United States
NYCEM
If today a magnitude 6 earthquake were to occur centered on New York City, what would its effects be? Will the loss be 10 or 100 billion dollars? Will there be 10 or 10,000 fatalities? Will there be 1,000 or 100,000 homeless needing shelter? Can government function, provide assistance, and maintain order?
At this time, no satisfactory answers to these questions are available. A few years ago, rudimentary scenario studies were made for Boston and New York with limited scope and uncertain results. For most eastern cities, including Washington D.C., we know even less about the economic, societal and political impacts from significant earthquakes, whatever their rate of occurrence.
Why do we know so little about such vital public issues? Because the public has been lulled into believing that seriously damaging quakes are so unlikely in the east that in essence we do not need to consider them. We shall examine the validity of this widely held opinion.
Is the public’s earthquake awareness (or lack thereof) controlled by perceived low Seismicity, Seismic Hazard, or Seismic Risk? How do these three seismic features differ from, and relate to each other? In many portions of California, earthquake awareness is refreshed in a major way about once every decade (and in some places even more often) by virtually every person experiencing a damaging event. The occurrence of earthquakes of given magnitudes in time and space, not withstanding their effects, are the manifestations of seismicity. Ground shaking, faulting, landslides or soil liquefaction are the manifestations of seismic hazard. Damage to structures, and loss of life, limb, material assets, business and services are the manifestations of seismic risk. By sheer experience, California’s public understands fairly well these three interconnected manifestations of the earthquake phenomenon. This awareness is reflected in public policy, enforcement of seismic regulations, and preparedness in both the public and private sector. In the eastern U.S., the public and its decision makers generally do not understand them because of inexperience. Judging seismic risk by rates of seismicity alone (which are low in the east but high in the west) has undoubtedly contributed to the public’s tendency to belittle the seismic loss potential for eastern urban regions.
Let us compare two hypothetical locations, one in California and one in New York City. Assume the location in California does experience, on average, one M = 6 every 10 years, compared to New York once every 1,000 years. This implies a ratio of rates of seismicity of 100:1. Does that mean the ratio of expected losses (when annualized per year) is also 100:1? Most likely not. That ratio may be closer to 10:1, which seems to imply that taking our clues from seismicity alone may lead to an underestimation of the potential seismic risks in the east. Why should this be so?
To check the assertion, let us make a back-of-the-envelope estimate. The expected seismic risk for a given area is defined as the area-integrated product of: seismic hazard (expected shaking level), assets ($ and people), and the assets’ vulnerabilities (that is, their expected fractional loss given a certain hazard – say, shaking level). Thus, if we have a 100 times lower seismicity rate in New York compared to California, which at any given point from a given quake may yield a 2 times higher shaking level in New York compared to California because ground motions in the east are known to differ from those in the west; and if we have a 2 times higher asset density (a modest assumption for Manhattan!), and a 2 times higher vulnerability (again a modest assumption when considering the large stock of unreinforced masonry buildings and aged infrastructure in New York), then our California/New York ratio for annualized loss potential may be on the order of (100/(2x2x2)):1. That implies about a 12:1 risk ratio between the California and New York location, compared to a 100:1 ratio in seismicity rates.
From this example it appears that seismic awareness in the east may be more controlled by the rate of seismicity than by the less well understood risk potential. This misunderstanding is one of the reasons why earthquake awareness and preparedness in the densely populated east is so disproportionally low relative to its seismic loss potential. Rare but potentially catastrophic losses in the east compete in attention with more frequent moderate losses in the west. New York City is the paramount example of a low-probability, high-impact seismic risk, the sort of risk that is hard to insure against, or mobilize public action to reduce the risks.
There are basically two ways to respond. One is to do little and wait until one or more disastrous events occur. Then react to these – albeit disastrous – “windows of opportunity.” That is, pay after the unmitigated facts, rather than attempt to control their outcome. This is a high-stakes approach, considering the evolved state of the economy. The other approach is to invest in mitigation ahead of time, and use scientific knowledge and inference, education, technology transfer, and combine it with a mixture of regulatory and/or economic incentives to implement earthquake preparedness. The National Earthquake Hazard Reduction Program (NEHRP) has attempted the latter while much of the public tends to cling to the former of the two options. Realistic and reliable quantitative loss estimation techniques are essential to evaluate the relative merits of the two approaches.
The current efforts in the eastern U.S., including New York City, to start the enforcement of seismic building codes for new constructions are important first steps in the right direction. Similarly, the emerging efforts to include seismic rehabilitation strategies in the generally needed overhaul of the cities’ aged infrastructures such as bridges, water, sewer, power and transportation is commendable and needs to be pursued with diligence and persistence. But at the current pace of new construction replacing older buildings and lifelines, it will take many decades or a century before a major fraction of the stock of built assets will become seismically more resilient than the current inventory is. For some time, this leaves society exposed to very high seismic risks. The only consolation is that seismicity on average is low, and, hence with some luck, the earthquakes will not outpace any ongoing efforts to make eastern cities more earthquake resilient gradually. Nevertheless, M = 5 to M = 6 earthquakes at distances of tens of km must be considered a credible risk at almost any time for cities like Boston, New York or Philadelphia. M = 7 events, while possible, are much less likely; and in many respects, even if building codes will have affected the resilience of a future improved building stock, M = 7 events would cause virtually unmanageable situations. Given these bleak prospects, it will be necessary to focus on crucial elements such as maintaining access to cities by strengthening critical bridges, improving the structural and nonstructural performance of hospitals, and having a nationally supported plan how to assist a devastated region in case of a truly severe earthquake. No realistic and coordinated planning of this sort exists at this time for most eastern cities.
The current efforts by the Federal Emergency Management Administration (FEMA) via the National Institute of Building Sciences (NIBS) to provide a standard methodology (RMS, 1994) and planning tools for making systematic, computerized loss estimates for annualized probabilistic calculations as well as for individual scenario events, is commendable. But these new tools provide only a shell with little regional data content. What is needed are the detailed data bases on inventory of buildings and lifelines with their locally specific seismic fragility properties. Similar data are needed for hospitals, shelters, firehouses, police stations and other emergency service providers. Moreover, the soil and rock conditions which control the shaking and soil liquefaction properties for any given event, need to be systematically compiled into Geographical Information System (GIS) data bases so they can be combined with the inventory of built assets for quantitative loss and impact estimates. Even under the best of conceivable funding conditions, it will take years before such data bases can be established so they will be sufficiently reliable and detailed to perform realistic and credible loss scenarios. Without such planning tools, society will remain in the dark as to what it may encounter from a future major eastern earthquake. Given these uncertainties, and despite them, both the public and private sector must develop at least some basic concepts for contingency plans. For instance, the New York City financial service industry, from banks to the stock and bond markets and beyond, ought to consider operational contingency planning, first in terms of strengthening their operational facilities, but also for temporary backup operations until operations in the designated facilities can return to some measure of normalcy. The Federal Reserve in its oversight function for this industry needs to take a hard look at this situation.
A society, whose economy depends increasingly so crucially on rapid exchange of vast quantities of information must become concerned with strengthening its communication facilities together with the facilities into which the information is channeled. In principle, the availability of satellite communication (especially if self-powered) with direct up and down links, provides here an opportunity that is potentially a great advantage over distributed buried networks. Distributed networks for transportation, power, gas, water, sewer and cabled communication will be expensive to harden (or restore after an event).
In all future instances of major capital spending on buildings and urban infrastructures, the incorporation of seismically resilient design principles at all stages of realization will be the most effective way to reduce society’s exposure to high seismic risks. To achieve this, all levels of government need to utilize legislative and regulatory options; insurance industries need to build economic incentives for seismic safety features into their insurance policy offerings; and the private sector, through trade and professional organizations’ planning efforts, needs to develop a healthy self-protective stand. Also, the insurance industry needs to invest more aggressively into broadly based research activities with the objective to quantify the seismic hazards, the exposed assets and their seismic fragilities much more accurately than currently possible. Only together these combined measures may first help to quantify and then reduce our currently untenably large seismic risk exposures in the virtually unprepared eastern cities. Given the low-probability/high-impact situation in this part of the country, seismic safety planning needs to be woven into both the regular capital spending and daily operational procedures. Without it we must be prepared to see little progress. Unless we succeed to build seismic safety considerations into everyday decision making as a normal procedure of doing business, society will lose the race against the unstoppable forces of nature. While we never can entirely win this race, we can succeed in converting unmitigated catastrophes into manageable disasters, or better, tolerable natural events.