The Big One Awaits
By MARGO NASH
Published: March 25, 2001
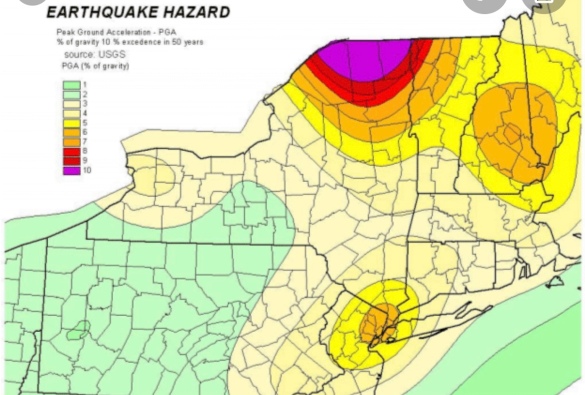
Alexander Gates, a geology professor at Rutgers-Newark, is co-author of “The Encyclopedia of Earthquakes and Volcanoes,“ which will be published by Facts on File in July. He has been leading a four-year effort to remap an area known as the Sloatsburg Quadrangle, a 5-by-7-mile tract near Mahwah that crosses into New York State. The Ramapo Fault, which runs through it, was responsible for a big earthquake in 1884, and Dr. Gates warns that a recurrence is overdue. He recently talked about his findings.
Q. What have you found?
A. We’re basically looking at a lot more rock, and we’re looking at the fracturing and jointing in the bedrock and putting it on the maps. Any break in the rock is a fracture. If it has movement, then it’s a fault. There are a lot of faults that are offshoots of the Ramapo. Basically when there are faults, it means you had an earthquake that made it. So there was a lot of earthquake activity to produce these features. We are basically not in a period of earthquake activity along the Ramapo Fault now, but we can see that about six or seven times in history, about 250 million years ago, it had major earthquake activity. And because it’s such a fundamental zone of weakness, anytime anything happens, the Ramapo Fault goes.
Q. Where is the Ramapo Fault?
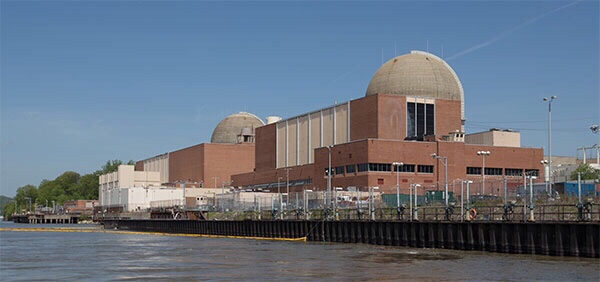
A. The fault line is in western New Jersey and goes through a good chunk of the state, all the way down to Flemington. It goes right along where they put in the new 287. It continues northeast across the Hudson River right under the Indian Point power plant up into Westchester County. There are a lot of earthquakes rumbling around it every year, but not a big one for a while.
Q. Did you find anything that surprised you?
A. I found a lot of faults, splays that offshoot from the Ramapo that go 5 to 10 miles away from the fault. I have looked at the Ramapo Fault in other places too. I have seen splays 5 to 10 miles up into the Hudson Highlands. And you can see them right along the roadsides on 287. There’s been a lot of damage to those rocks, and obviously it was produced by fault activities. All of these faults have earthquake potential.
Q. Describe the 1884 earthquake.
A. It was in the northern part of the state near the Sloatsburg area. They didn’t have precise ways of describing the location then. There was lots of damage. Chimneys toppled over. But in 1884, it was a farming community, and there were not many people to be injured. Nobody appears to have written an account of the numbers who were injured.
Q. What lessons we can learn from previous earthquakes?
A. In 1960, the city of Agadir in Morocco had a 6.2 earthquake that killed 12,000 people, a third of the population, and injured a third more. I think it was because the city was unprepared.There had been an earthquake in the area 200 years before. But people discounted the possibility of a recurrence. Here in New Jersey, we should not make the same mistake. We should not forget that we had a 5.4 earthquake 117 years ago. The recurrence interval for an earthquake of that magnitude is every 50 years, and we are overdue. The Agadir was a 6.2, and a 5.4 to a 6.2 isn’t that big a jump.
Q. What are the dangers of a quake that size?
A. When you’re in a flat area in a wooden house it’s obviously not as dangerous, although it could cut off a gas line that could explode. There’s a real problem with infrastructure that is crumbling, like the bridges with crumbling cement. There’s a real danger we could wind up with our water supplies and electricity cut off if a sizable earthquake goes off. The best thing is to have regular upkeep and keep up new building codes. The new buildings will be O.K. But there is a sense of complacency.
MARGO NASH