A LOOK AT NEW YORK CITY’S EARTHQUAKE RISKS
By Spectrum News NY1 | April 2, 2018 @4:32 PM
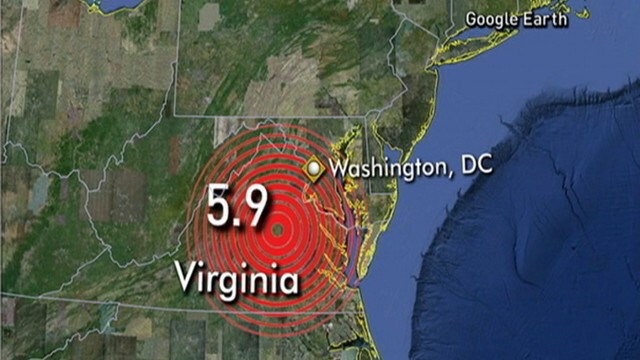
Not every New Yorker felt when the ground shook on August 23, 2011.
When a magnitude 5.8 earthquake cracked the soil near Mineral, Virginia that day, the energy traveled through the Northeast.
Some New Yorkers watched their homes tremor, while others felt nothing.
Researchers say New York City is due for a significant earthquake originating near the five boroughs, based on previous smaller earthquakes in and around the city. While New York is at moderate risk for earthquakes, its high population and infrastructure could lead to significant damage when a magnitude 5 quake or stronger hits the area.
Unbeknownst to many, there are numerous fault lines in the city, but a few stand out for their size and prominence: the 125th Street Fault, the Dyckman Street Fault, the Mosholu Parkway Fault, and the East River Fault.
The 125th Street Fault is the largest, running along the street, extending from New Jersey to the East River. Part of it runs to the northern tip of Central Park, while a portion extends into Roosevelt Island.
The Dyckman Street Fault is located in Inwood, crossing the Harlem River and into Morris Heights, while the Mosholu Parkway Fault is north of the Dyckman Street and 125th Street Faults.
The East River Fault looks a bit like an obtuse angle, with its top portion running parallel, to the west of Central Park, before taking a horizontal turn near 32nd St. and extending into the East River and stopping short of Brooklyn.
Just outside of the city is the Dobbs Ferry Fault, located in suburban Westchester; and the Ramapo Fault, running from eastern Pennsylvania to the mid-Hudson Valley, passing within a few miles northwest of the Indian Point Nuclear Plant, less than 40 miles north of the city and astride the intersection of two active seismic zones.
The locations of faults and the prevalence of earthquakes is generally not a concern for most New Yorkers. One reason might be that perceptions of weaker earthquakes vary widely.
On Nov. 30, a magnitude 4.1 earthquake, centered near Dover, Delaware, could be felt in nearby states. Less than 200 miles away in New York City, some people reported on social media that they felt their houses and apartments shaking. At the same time, some New Yorkers, again, did not feel anything:
Won-Young Kim is a senior research scientist at Columbia University’s Lamont-Doherty Earth Observatory, which monitors and records data on earthquakes that occur in the northeast. Kim says it’s not clear who feels smaller earthquakes, as evident by a magnitude 0.8 quake in the city in December of 2004.
„Hundreds of people called local police, and police called us. Our system was unable to detect that tiny earthquake automatically,“ Kim said. „We looked at it, and, indeed, there was a small signal.“
Kim says some parts of the city will feel magnitude 1 or 2 earthquakes even if the seismic activity does not result in any damage.
You have to go back to before the 20th Century, however, to find the last significant earthquake that hit the city. According to Lamont-Doherty researchers, magnitude 5.2 earthquakes occurred in 1737 and 1884. In newspaper accounts, New Yorkers described chimneys falling down and feeling the ground shake underneath them.
„1737 — that was located close to Manhattan,“ Kim said. „It was very close to New York City.“
According to Kim, the 1884 quake was felt in areas in or close to the city, such as the Rockaways and Sandy Hook, New Jersey. But it was felt even as far away as Virginia and Maine.
From 1677 to 2007, there were 383 known earthquakes in a 15,000-square-mile area around New York City, researchers at Lamont-Doherty said in a 2008 study.
A 4.9 located in North Central New Jersey was felt in the city in 1783; a 4 hit Ardsley in 1985; and in 2001, magnitude 2.4 and 2.6 quakes were detected in Manhattan itself for the first time.
But the 1737 and 1884 quakes remain the only known ones of at least magnitude 5 to hit the city.
Smaller earthquakes are not to be ignored. Lamont-Doherty researchers say frequent small quakes occur in predictable ratios to larger ones and thus can be used — along with the fault lengths, detected tremors and calculations of how stress builds in the crust — to create a rough time scale.
Researchers say New York City is susceptible to at least a magnitude 5 earthquake once every 100 years, a 6 about every 670 years, and 7 about every 3,400 years.
It’s been 134 years since New York was last hit by at least a magnitude 5. When it happens next, researchers say it won’t be much like 1884.
The city’s earthquake hazard is moderate, according to the New York City Area Consortium for Earthquake Loss Mitigation (NYCEM), but experts agree that, due to its higher population and infrastructure, the damage would be significant.
Before 1995, earthquake risks were not taken into consideration for the city’s building code. Thus, Lamont-Doherty says many older buildings, such as unenforced three- to six-story buildings, could suffer major damage or crumble.
The damage an earthquake causes is also dependent on what’s in the ground. According to the U.S. Geological Survey, bedrock is more resistant to earthquakes than sediment.
The upper third of Manhattan has harder soil that is more resistant to shaking. Parts of Midtown are more susceptible, while Downtown Manhattan’s soil is even softer, according to the NYCEM.
Exceptions to Upper Manhattan’s strength? Portions of Harlem and Inwood — both areas consist of a large amount of soft soil. Central Park has the strongest soil in Manhattan, outside of a small segment of Inwood..
Not all boroughs are created equal. While the Bronx is also made of solid bedrock, the ground in Queens and Brooklyn is softer.
„If you go to Queens and Brooklyn, you have sediment, so there would be more shaking relative to Manhattan,“ Kim said. „So, it’s not easy to say the damage would be the same.“
Analysis pins the damage from a magnitude 5 earthquake hitting New York City in the billions, according to Lamont-Doherty.
New York City is not a hotbed for seismic activity; it is not close to a tectonic plate, and it is not clear if one of the faults would be the source of a strong quake. But the predicted damage to the city has concerned many experts.
Until that day, earthquakes are isolated events for New Yorkers. Some have felt the ground move, while others have only felt shaking when subway cars travel underground.
But researchers agree: One day, the ground will wake up in the city that never sleeps, and all New Yorkers will understand what Mineral, Virginia felt when their homes rattled with the earth.
 Released: 11/6/2012 8:30:00 AM